Analysing test results with a simple table: question difficulty and class gaps
Mark each student 1 or 0 on each question, then work out the percent correct in each column: a question fewer than half the class got right goes back to the whole class, and one between half and 80% goes to a small group. Then group students by the questions they missed together, not by their totals.
Test results analysis grid — for a class of up to 30
A free printable PDF, no sign-up.
- Definition
- Item difficulty (percent correct): The percentage of students who answered a question correctly. The higher it is, the easier the question was for this class.
A student's mark tells you who needs help; it does not tell you what to reteach. The questions do: which ones half the class missed, and which ones only certain students missed. The University of Washington's guide to item analysis defines the difficulty of a question with one correct answer as the percentage of students who answer it correctly, from 0 to 100 — the higher the value, the easier the question. And in “Inside the Black Box” (Phi Delta Kappan, October 1998), Paul Black and Dylan Wiliam write that assessment becomes formative when the evidence is actually used to adapt the teaching to meet student needs. That is why every column in the table below ends in a decision.
What you need
- The marked test papers, question by question.
- Squared paper, or a spreadsheet in Excel or Google Sheets.
- One line per question saying which skill it measures. Without it you will know question 6 was hard, but not what to reteach.
The steps: from marked papers to a decision on each question
Write the skill above each question
Before you record anything, write above each question number the skill it measures, in a few words: “adding fractions with unlike denominators”, not “fractions”. If a question measures two skills, a wrong answer will not tell you which one is missing.
Record 1 or 0, not the mark
One student per row, one question per column. Write 1 for a correct answer and 0 for a wrong or blank one. If a question is worth more than one mark, record the mark, then divide the class's average on it by the full mark.
Work out the percent correct in each column
Add up the 1s in the column, divide by the number of students and multiply by 100. In a class of 30, 15 correct answers is 50% and 24 is 80%, so you can place a question without a calculator.
Decide on each question with three thresholds
These thresholds are our suggestion, not a published rule: under 50% means the whole class needs it taught again a different way; 50% to 79% means a small group of those who missed it; 80% or more means one-by-one follow-up. The lower threshold is close to the University of Washington's bands, which call a question hard at 50% correct or below, moderate from 51% to 84%, and easy at 85% or above.
Look for weak questions that share one skill
Sort the questions under 50% by their skills. Three weak questions that rest on one step are one gap, not three, and one reteach covers them.
Group students by their mistakes, not their totals
Two students who each scored 9 out of 10 may need different things. Read each student's row: which set of questions did they miss? The groups come from the answer.
A full example: a 10-question fractions quiz for a class of 30
The data in this example are sample data, written for this post, not the results of a real class. The test is a short Grade 6 quiz on fractions, with each question measuring one skill. A Grade 6 maths short quiz gives a printable one you can read the same way.
| Question | Skill | Correct out of 30 | Percent correct | Decision |
|---|---|---|---|---|
| 1 | Equivalent fractions | 28 | 93% | Individual follow-up |
| 2 | Comparing fractions with the same denominator | 28 | 93% | Individual follow-up |
| 3 | Comparing fractions with unlike denominators | 19 | 63% | Small group |
| 4 | Simplifying a fraction | 25 | 83% | Individual follow-up |
| 5 | Adding fractions with the same denominator | 28 | 93% | Individual follow-up |
| 6 | Adding fractions with unlike denominators | 14 | 47% | Whole class |
| 7 | Subtracting fractions with unlike denominators | 14 | 47% | Whole class |
| 8 | Mixed number to improper fraction | 23 | 77% | Small group |
| 9 | Word problem: adding fractions with unlike denominators | 9 | 30% | Whole class |
| 10 | A fraction of a quantity | 22 | 73% | Small group |
The class average is 7 out of 10, or 70% — a number that looks reassuring. It hides three questions below half: 6, 7 and 9. Read their skills and you find that they, together with question 3, all rest on one step: finding a common denominator. So the decision is one reteach of that step for the whole class, not four lessons.
Question 9 has a lower percent correct than question 6, although both test the same operation. Twenty-one students missed question 9; 15 of them also missed question 6, and 6 got question 6 right but missed question 9. Those six can add fractions; what they lack is turning the words of a problem into an operation.
The groups: who needs what
| Group | Students | What they share | What you do |
|---|---|---|---|
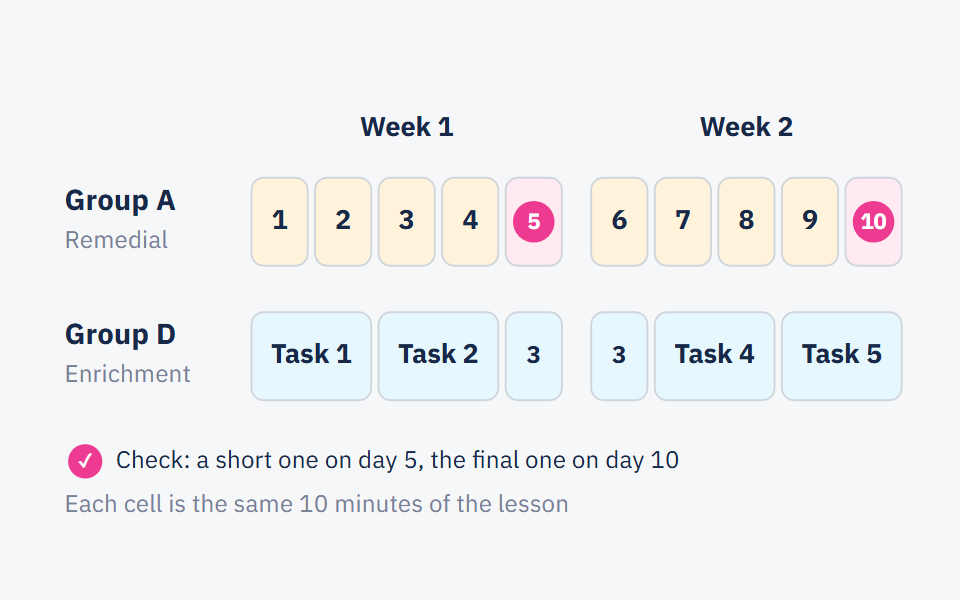
| A: common denominators | 11 to 22 (12 students) | Missed at least three of questions 3, 6, 7 and 9, and got the basic questions 1, 2 and 5 right | They join the whole-class reteach, then spend ten minutes with you in guided practice on that one step |
| B: what a fraction means | 23 to 26 (4 students) | Each scored 2 or 3, and each missed at least one of the basic questions 1, 2 and 5 | A remedial plan that starts with what a fraction means and how big it is, before common denominators — see the remedial plan |
| C: word problems | 5 to 10 (6 students) | Got question 6 right and question 9 wrong | Short practice in reading a problem: what is asked, which operation, then a drawing of it before any calculation |
| D: enrichment | 1 to 4, and 29 (5 students) | Each scored 9 or 10, and none missed questions 3, 6, 7 or 9 | A harder task on the same skill, such as adding three fractions with unlike denominators |
| No group | 27, 28 and 30 (3 students) | Each scored 8, with scattered mistakes | A quick check-in with each during independent practice |
Notice that students 3 and 5 both scored 9 but sit in different groups: student 3 missed a fraction of a quantity, and student 5 missed the word problem. The total alone would have put them together.
The same table in Excel or Google Sheets: four formulas
Put the students' numbers or names in column A, rows 2 to 31, and the questions in columns B to K, so question 1 is in column B and question 10 in column K. Then type:
| What it works out | Formula | Where it goes |
|---|---|---|
| The student's total | In L2, then fill down to L31 | |
| How many got the question right | In B32, then fill across to K32 | |
| Percent correct on the question | In B33, formatted as a percentage, then fill across to K33 | |
| The student's mistakes on the common-denominator questions (3, 6, 7, 9) | In M2, then fill down to M31 |
AVERAGE gives you the percent correct directly, because the average of a column of 1s and 0s is the share of 1s in it: in our example, 28 out of 30 on question 1, or about 93%. The formulas follow the help pages for COUNTIF and AVERAGE in Excel, and COUNTIF and AVERAGE in Google Sheets. Microsoft's Arabic help page also writes the function by its English name, COUNTIF, in its examples.
When the table is not enough
- One test is not a verdict: the University of Washington guide says item analysis data are tentative, and that they are influenced by who took the test, how it was taught and chance. Check the decision before you build a week on it; one question on an exit ticket after the reteach is enough.
- A weak question may be badly written: the same guide notes that a question with low discrimination — one the strongest students get right no more often than the rest — is often ambiguously worded, and that one they get right less often than the rest may have the wrong answer key. Reread the question and its key before you reteach the lesson.
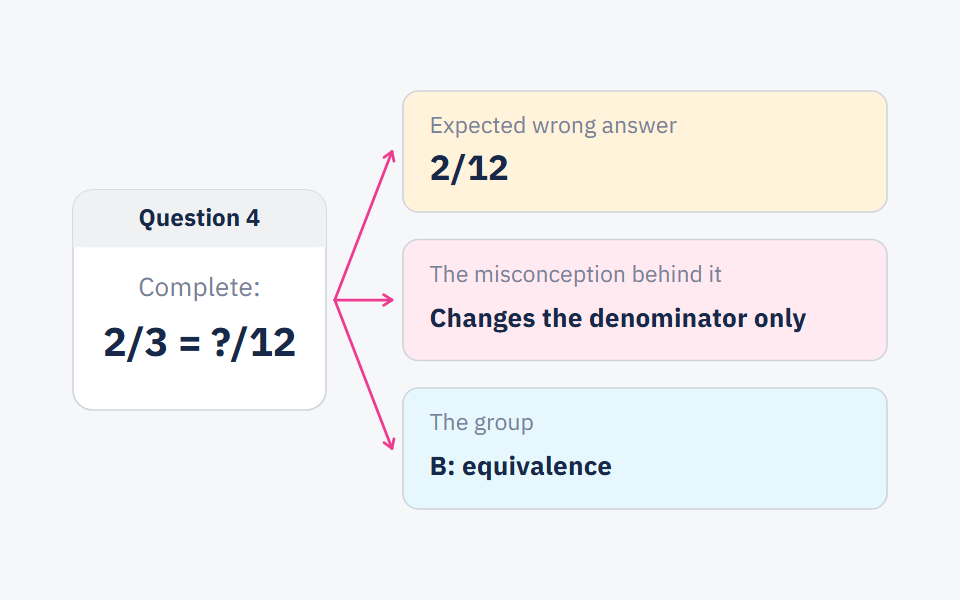
- The percent says who missed it, not why: for the reason, look at the wrong answers themselves. If you want to know it before the unit rather than after, write questions whose wrong answers reveal the misconception, as in the diagnostic test.
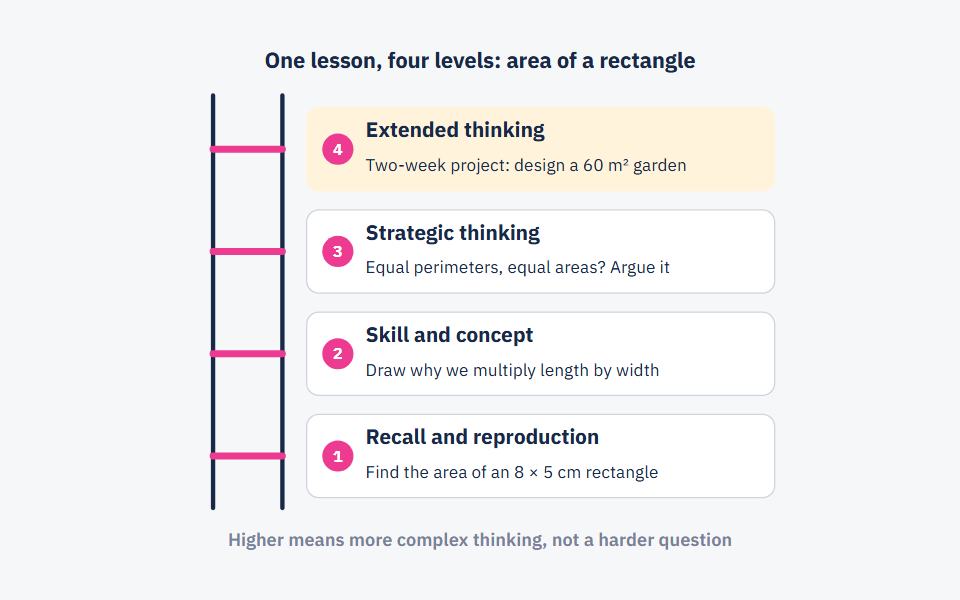
- Hard is not the same as deep: a question most of the class missed may be a long routine procedure, not one that demands deeper thinking. Depth of Knowledge explains the difference.
Frequently asked questions
- How do I work out item difficulty for a test question?
- Divide the number of students who got it right by the number of students, then multiply by 100: 14 out of 30 gives about 47%. The higher the number, the easier the question was for this class.
- Can I analyse results without Excel?
- Yes. Draw the grid on squared paper, write 1 or 0 in each cell, then count the 1s in each column. In a class of 30, 15 correct answers is 50% and 24 is 80%.
- What is the difference between analysing results and recording marks?
- Recording marks reads the table row by row: each student's total. Analysing results also reads it column by column: the percent correct on each question. The first tells you who needs help; the second tells you what to reteach.
- At what percent should I reteach a question?
- Our suggestion: under 50% for the whole class, 50% to 79% for a small group, and 80% or more for one-by-one follow-up. These are working thresholds, not a published rule; adjust them by how much the next lessons depend on the skill.
Sources
Every fact in this post that we did not produce ourselves comes from one of these sources.
- Understanding Item Analyses — Institutional Assessment & Evaluation, University of Washington, undated (page © 2026)
- Inside the Black Box: Raising Standards Through Classroom Assessment (Paul Black, Dylan Wiliam) — Phi Delta Kappan (Kappan Online), 1998-10-01
- COUNTIF function — Microsoft Support, undated (checked 2026-10-22)
- استخدام الدالة COUNTIF في Microsoft Excel — Microsoft Support (Arabic), undated (checked 2026-10-22)
- AVERAGE function — Microsoft Support, undated (checked 2026-10-22)
- COUNTIF — Google Docs Editors Help, undated (checked 2026-10-22)
- AVERAGE — Google Docs Editors Help, undated (checked 2026-10-22)
Written with String's editorial team: we use AI for research and first drafts, and a person checks every fact and every source before anything is published. How we write
Founder and CEO, String
“I grew up in a house of teachers.” I spent a year designing the STEM program for one of the largest school groups in Saudi Arabia, have written curriculum by hand, trained robotics coaches and sold software into schools, then left that job to build String in Amman.