The bar model: how Grade 6 students solve word problems
Students draw each quantity in a problem as a bar, so they see how the quantities relate before choosing an operation. Most Grade 6 word problems take one of five shapes: part-whole, comparison, fraction of a quantity, ratio, and before and after. Here is each one with a worked example and the question that gets a student drawing it.
The bar model — five templates and five practice problems
A free printable PDF, no sign-up.
- Definition
- Bar model: A drawing in which a student represents each quantity in a word problem as a rectangle, to see how the quantities relate before choosing an operation. Also called a strip diagram or tape diagram.
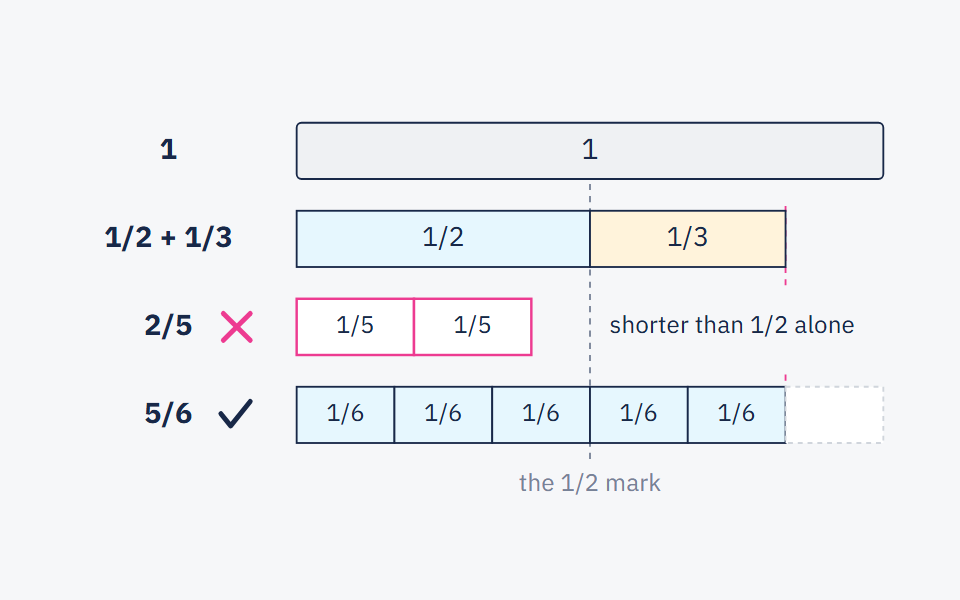
A student who is stuck on a word problem usually knows how to add or divide; what they don't know is which one to pick. The bar puts that question off: draw what the problem says first, and the calculation shows itself in the drawing. You don't need dozens of shapes either. Most of what Grade 6 students meet falls into five kinds, drawn at the top of this page.
Why students draw before they calculate
The Institute of Education Sciences (IES) practice guide on improving mathematical problem solving in grades 4 through 8 (May 2012) recommends that teachers teach students how to use visual representations, and rates the evidence for that recommendation as strong: six studies with middle school students consistently found that using visual representations improved achievement. The guide says that students who learn to visually represent the mathematical information in problems before writing an equation are more effective at problem solving.
The guide calls the bar a strip diagram, defines it as rectangles that represent the quantities in the problem, and says it suits comparison and fraction problems. In four of the six studies, students were taught to tell types of problem apart and then to use the diagram that fits each type. The five kinds below are built on that idea: a student learns a shape once, then recognises it in every problem like it. The guide's panel also advises teaching a few types of visual representation consistently rather than overwhelming students with many examples.
Five kinds of problem, each with its own bar
The five problems were written for this post, not copied from a textbook. Under each one is the question you ask so the student starts the drawing, instead of you drawing it for them. The bars run left to right, as in a maths book, in both languages.
1. Part-whole: the whole is known, a part is not
- Draw one long bar for all the books and write 1200 above it.
- Split it into three parts: 365, 418, and an unknown part for Grade 4.
- The known parts together: .
- The unknown part is what is left of the whole: . So Grade 4 brought 417 books.
- Check: .
Your question to the student: “Is there a whole and its parts here? Which do you know: the whole or the parts?”
2. Comparison: more than, less than
- Draw Class B's bar first, because it is the smaller one, and mark it with a question mark.
- Under it, draw Class A's bar the same length as Class B's, then add a small piece and write 24 on it.
- Put a brace over both bars and write 150 on it.
- Take the extra piece off the total: . What is left is two equal bars: .
- Class B collected 63 cans and Class A collected . Check: , and .
Your question to the student: “Who has more? Draw the shorter bar first. How much longer is the other one?” If the problem said “Class B collected 24 fewer cans than Class A”, the drawing would not change. “Fewer” does not always mean subtract; the drawing decides the operation, not the word.
3. Fraction of a quantity: one bar in equal parts
- Draw a bar for the full tank and write 360 above it.
- The denominator is 8, so split the bar into eight equal parts and shade three of them for what was used.
- One part: litres.
- Five parts are left: . So 225 litres were left in the tank.
- Check: the water used is , and .
Your question to the student: “How many equal parts do you split the bar into? And what is one part worth?” This is where a student sees what the denominator and the numerator each do, as the IES guide on teaching fractions (September 2010) puts it: denominators define the size of the fractional part, and numerators represent the number of this part. It is the same idea a student needs to fix the add-the-denominators mistake.
4. Ratio: equal units for two quantities
- Draw a bar of five equal units for the storybooks, and a bar of three units of the same size for the science books.
- There are units in all, and together they make 96.
- One unit: .
- The science books are three units: books; the storybooks are .
- Check: , and after dividing both by 12.
Your question to the student: “How many equal units does each quantity get? And what do all the units make together?” If the problem gives the difference instead of the total (“there are 24 more storybooks than science books”), the same drawing works: the two extra units in the storybook bar equal 24, so one unit is 12.
5. Before and after: a quantity that changes
- Draw a before bar of four equal parts, and cross out three of them for the notebooks sold.
- Under it, draw the after bar: the part that was left, with a piece beside it for the 50 new notebooks, and 140 over both.
- The part that was left: notebooks.
- The first bar is four parts: . So the shop had 360 notebooks at the start.
- Check: it sold of 360, which is 270 notebooks, so 90 were left, and .
Your question to the student: “Draw the before bar first. What happened to it? What does the after bar look like?” This is the hardest of the five, because the unknown is at the start rather than the end, and the drawing lets a student work the problem backwards without an equation.
After every drawing, ask the student to write the number sentence the bar is saying. The same guide recommends showing students how the information they drew is turned into mathematical notation: every part of the drawing matches a number or a relationship in the equation. The bar is a way to the calculation, not a replacement for it.
How to introduce it over three lessons
We suggest you don't introduce all five kinds in one lesson: give them about twenty minutes of each of three lessons in a row, and keep the rest for the day's topic. The guide recommends that teachers think aloud as they draw: not only saying what they are doing, but why they chose this drawing for this problem.
Lesson 1 (20 minutes): part-whole, then comparison
5 minutes: draw the first problem in front of the class and think aloud: “I know the total and I don't know one part of it, so I'll draw one bar and split it.” 10 minutes: in pairs, students draw two problems with small numbers they could solve in their heads; today the point is the drawing, not the calculation. 5 minutes: each student writes the number sentence under their drawing.
Lesson 2 (20 minutes): fraction of a quantity, then ratio
Start with a question: “What do these two drawings have in common?” The answer you want is equal parts. 5 minutes for the fraction problem, which you solve in front of the class; 5 for the ratio problem, which students solve with you; then 10 minutes in which every student solves one problem of each kind alone.
Lesson 3 (25 minutes): before and after, then sorting
10 minutes on a before-and-after problem. Then 15 minutes sorting six mixed problems: students write the kind of each problem and sketch the shape of its bar only, without calculating. Ask the guide's questions: “What kind of problem is this? How do you know?”, “What is the relevant information in this problem?” and “Which visual representation did you use when you solved this type of problem last time?” Then they solve two problems all the way through.
After the three lessons, keep the same drawing for the same kind of problem all year: the guide advises teachers to select the representation that works best for their students and use it consistently for similar problems. If you want every student working during those minutes rather than only listening, Active learning in a maths lesson has ways to do it, with timings.
When the bar model does not help
- When the operation is obvious at a glance: a one-step problem with small numbers needs no drawing, and forcing one makes the bar feel like extra homework. Save it for problems where students hesitate.
- When the student draws the picture, not the relationship: notebooks, cans and water tanks drawn in full detail. The guide names this exact roadblock: drawings with unnecessary details that miss the relevant relationships. It suggests asking guiding questions, then asking the student to explain what was missing from their first drawing. Remind them that a bar is a rectangle and a number, nothing more.
- In proportion and percent problems: the guide says strip diagrams suit comparison and fraction problems, while schematic diagrams work well with ratio and proportion problems and percent bars suit percent problems. The bar works for ratio when the problem gives you a total or a difference, as in the fourth example; for a problem like “2 for every 10, so how many for 30?”, a table may be clearer.
- When students learn all five shapes in one day: everything blurs together. Two kinds per lesson is enough.
If a parent asks how to help with this method at home, send them Helping with maths without contradicting the teacher's method, which draws one problem in bars step by step. And before the exam, the fifth kind makes a good question for the two review lessons before the end-of-term exam.
Frequently asked questions
- What is a bar model in math?
- A way to solve word problems in which the student draws each quantity as a rectangle, to see how the quantities relate before choosing an operation. The IES guide calls it a strip diagram.
- What kinds of word problems can you solve with a bar model?
- Five kinds cover most Grade 6 problems: part-whole, comparison (more than, less than), fraction of a quantity, ratio, and before and after. Each has a fixed shape, drawn on this page.
- When do students stop drawing bars?
- We suggest they stop when they can name the kind of problem and see the operation without drawing. A quick sketch in the margin stays a tool they come back to for harder problems, before-and-after ones especially.
- What is the difference between a bar model and an equation?
- The bar is the equation, drawn. In the tank example, the eight parts are , and the five parts left are . That is why you ask students to write the number sentence under every drawing.
Sources
Every fact in this post that we did not produce ourselves comes from one of these sources.
- Improving Mathematical Problem Solving in Grades 4 Through 8 (Woodward et al.), IES Practice Guide NCEE 2012-4055 — Institute of Education Sciences, What Works Clearinghouse (via ERIC), 2012-05
- Developing Effective Fractions Instruction for Kindergarten Through 8th Grade (Siegler et al.), IES Practice Guide NCEE 2010-4039 — Institute of Education Sciences, What Works Clearinghouse (via ERIC), 2010-09
Written with String's editorial team: we use AI for research and first drafts, and a person checks every fact and every source before anything is published. How we write
Grade 6 mathematics · Jordan
Teaches Grade 6 mathematics in Jordan and writes here about teaching maths from inside the classroom.