How to measure the teacher time a tool really saves
Do not ask teachers how much time a tool saved; ask them to log it for a week before the tool and a week after, for three named tasks, then compare minutes per item with the time spent checking the tool's output included. The result is a number for your own school, with limits you know.
Teacher time log — one week
A free printable PDF, no sign-up.
This method is for the principal or academic head who has heard that a tool “saves teachers hours every week” and wants to know whether that is true in their school. The answer does not come from a survey asking teachers how much time they saved. It comes from a log kept to the minute: a week before the tool and a week after it, for three named tasks.
The question deserves measuring. In a Pew Research Center survey of 2,531 US public K-12 teachers from RAND's American Teacher Panel, conducted from 17 October to 14 November 2023 and published in April 2024, 84% said there is not enough time during their regular work hours for tasks like grading, lesson planning, paperwork and answering work emails. But the time-saved figures that circulate are estimates. In a Gallup and Walton Family Foundation survey published on 14 October 2026, 64% of US educators who used AI tools in the 2025–26 school year said it gave them more time, 29% said it made no difference, and 7% said it cost them time. The “almost six hours a week” for weekly AI users that The 74 reported in July 2025 also came from a poll. These are US teachers' and educators' answers about themselves, not time logs, and they tell you nothing about your school.
What you need
- Three tasks that come round every week, with items you can count: writing a quiz, marking a class set, and a message to a parent, for example.
- Three to six teachers who will use the tool for those tasks.
- A time log, on paper or on screen, the same one in both weeks. There is a printable copy at the end of the page.
- One person who collects the logs, does the arithmetic and writes up the result.
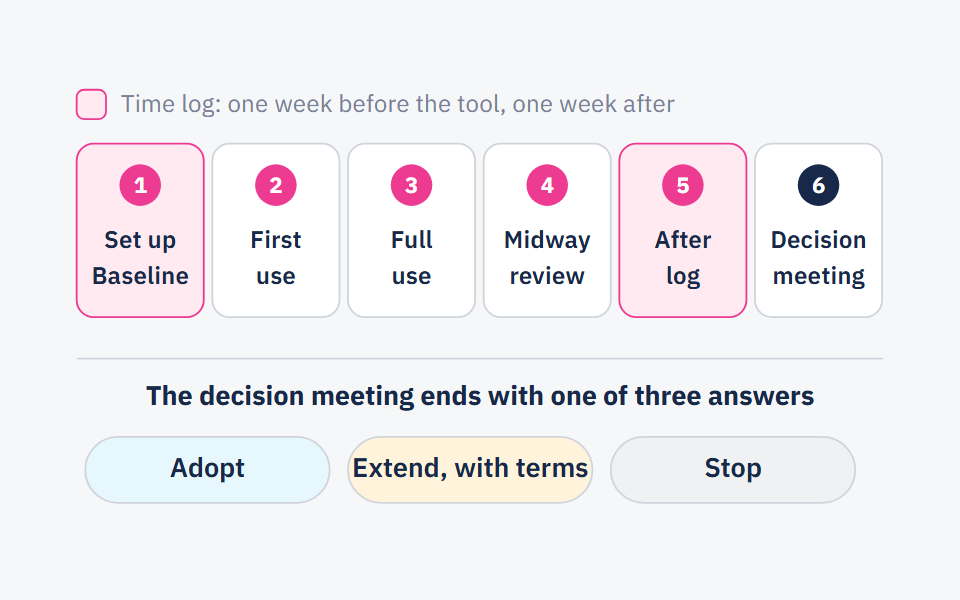
- Four to six weeks in the calendar: a week before, a learning period, a week after. If the tool is being piloted, these are weeks one and five of the six-week pilot plan.
- A written agreement that the log is never used to appraise a teacher. Anyone who fears being judged on their log may round their numbers.
The steps
Choose three tasks, and define where each starts and ends
For example: “Writing a quiz starts when you open the file and ends when it is ready to print or post.” And set the unit for each task: the quiz, the marked paper, the message. Without that definition, each teacher measures something different.
Log the “before” week the current way
Each time a teacher does one of the tasks, they write down the date, the task, the number of items, and the start and end time. They write it at the time, not at the end of the week, because memory rounds. The idea of a set week comes from England's Teacher Workload Survey, which in March 2019 asked more than 7,000 teachers and school leaders about their working hours in one specific “reference week”.
Leave a learning period of two to three weeks, unlogged
In the first days teachers are learning the tool, and timing them measures the learning, not the tool. Teachers use the tool for the three tasks as usual and log nothing.
Log the “after” week with the tool, on the same log
Same tasks, same definitions, same sheet. Teachers add one column: how many minutes went on checking or correcting what the tool produced. That time is part of the task, not something outside it.
Work out minutes per item, for each teacher
Divide the total minutes for a task by its number of items, for each week separately. Do not compare the two weeks' totals, because the number of quizzes and papers changes from week to week.
Put the results together and read them with the teachers
For each task, write down each teacher's difference, then the median and the range, and ask the teachers what changed in the quality of what they produced. The next section shows this with an example.
A full example: one teacher's log, then three teachers
One teacher, a week before and a week after. In the “after” week the minutes include checking time: 30 minutes of the time spent writing the two quizzes, and 30 minutes of the marking time.
| Task | Item | Before: minutes ÷ items | After: minutes ÷ items | Difference per item |
|---|---|---|---|---|
| Writing a quiz | Quiz | 20 minutes | ||
| Marking a class set | Paper | 1 minute | ||
| A parent message | Message | 3 minutes |
In an ordinary week for this teacher, with two quizzes, 60 papers and 4 messages, the difference is minutes. That is one teacher in one week, not a result yet.
Three teachers. Their difference for writing a quiz was 20, 5 and minutes per quiz; the tool slowed the third teacher down. The median is 5 minutes and the range runs from to 20. The result you write down: “For writing a quiz, the tool saved a typical teacher of the three about 5 minutes per quiz, and slowed one teacher down.” Not: “It saves 20 minutes”, which is the fastest teacher's number alone.
How to read the result honestly
- Compare minutes per item, not weekly totals. A week with one quiz looks lighter than a week with three, whatever the tool.
- Always count checking time. A tool that writes a quiz in a minute, which the teacher then spends twenty minutes fixing, saved less than it seems.
- Report the median and the range, not the best teacher. The median tells you what happens for a typical teacher; the range tells you whether the tool slowed anyone down.
- Ask about quality. Add one question to the log: “Did you use what the tool produced as it was, or did you change it?” A quiz written faster and then rewritten the next day is not a saving.
- Do not change the method between the two weeks. Even England's survey warned, in its research brief, that small differences in the content and administration of the 2016 and 2019 surveys may partly account for the gap between their results. If you change the task definition or the log, you are measuring the change, not the tool.
What not to conclude from the log
- Do not multiply one week by the weeks in a year. One week after the learning period says nothing about exam season, or about what happens once the novelty wears off. Measure again after a term if the decision is a big one.
- Minutes saved are not necessarily time freed for teaching. Where the time goes is a separate question, for the teachers themselves, and the log does not answer it.
- Three teachers are not the whole school. The result belongs to these tasks and these teachers, and does not carry over as it is to another subject or stage.
- Do not compare your number with one from a sales deck, or with a survey figure from another country. Your number is only good for comparing with your school's next measurement.
- Do not turn the log into an appraisal tool. The moment it is used to hold people to account, the numbers written in it change.
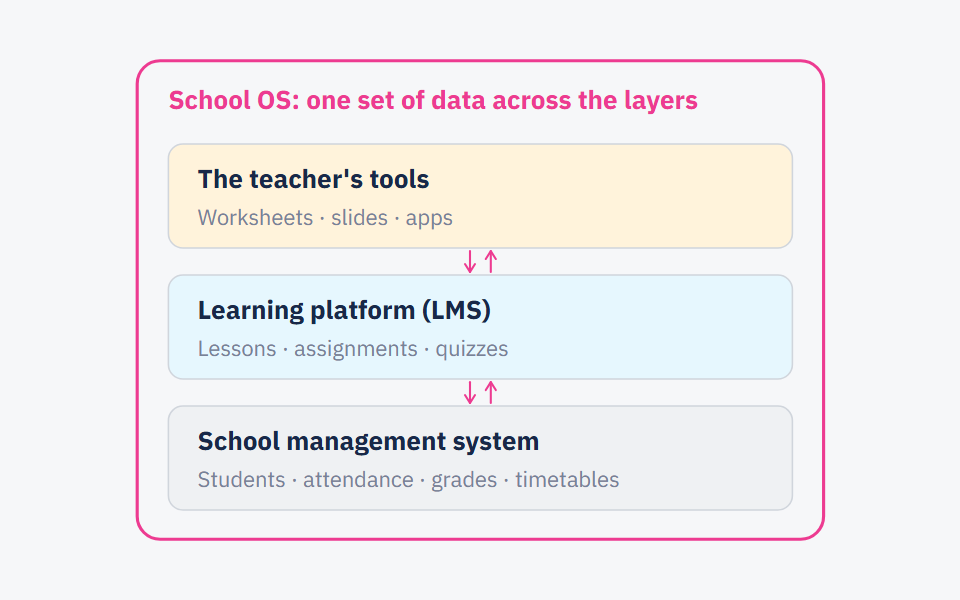
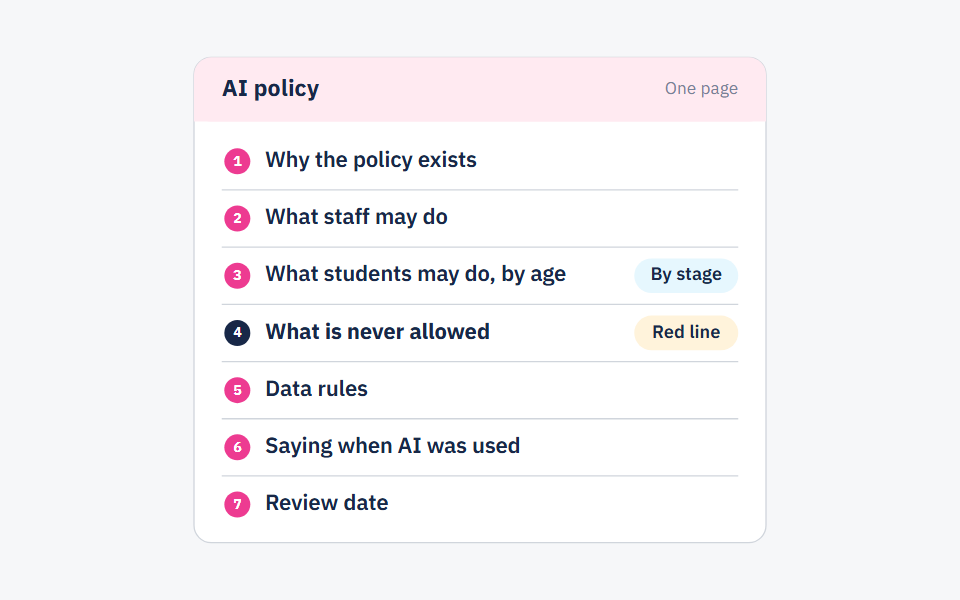
If the tool handles student data or uses AI, measurement alone is not enough to decide; put it beside your school's AI policy, and beside the difference between the kinds of system if it is not clear which kind you are measuring.
Frequently asked questions
- How do we measure teacher workload in a school?
- Pick the tasks that take time every week, and ask a small number of teachers to log their time on them to the minute, in one set week, as they do them. Then repeat with the same log after any change, and compare.
- Why isn't it enough to ask teachers how much time the tool saved?
- Because the question measures an impression, not time. The impression is useful, so ask about it, but put it beside the log, not in its place.
- How many teachers do we need?
- Three to six is enough for a pilot decision. Fewer than three makes the result one teacher's view; more than six is hard for one person to collect.
- Should the time log be used to appraise teachers?
- No. Say so in writing before you start, and use a code instead of the teacher's name on the log; a log that is used against its author is not filled in honestly.
Sources
Every fact in this post that we did not produce ourselves comes from one of these sources.
- Teachers Using AI Say It Frees Up Time for What Matters Most (Megan Brenan) — Gallup, with the Walton Family Foundation, 2026-10-14
- Survey: 60% of Teachers Used AI This Year and Saved up to 6 Hours of Work a Week — The 74, 2025-07-08
- What's It Like To Be a Teacher in America Today? — Pew Research Center, 2024-04-04
- Teacher Workload Survey 2019: research brief (DFE RB951) — Department for Education (England), 2019-10
Written with String's editorial team: we use AI for research and first drafts, and a person checks every fact and every source before anything is published. How we write
Founder and CEO, String
“I grew up in a house of teachers.” I spent a year designing the STEM program for one of the largest school groups in Saudi Arabia, have written curriculum by hand, trained robotics coaches and sold software into schools, then left that job to build String in Amman.